.jpg)
(Image: Pixabay)
Rapidly rising emissions from China’s agricultural machinery could “hinder” the country’s push to net-zero, according to new research.
The study, published in Nature Food, finds that carbon dioxide (CO2) emissions from agricultural machinery have increased approximately seven-fold in the country since 1985.
Using government statistics on the quantity of farm equipment over time, researchers calculate the changes in CO2 emissions and other air pollutants between 1985 and 2020.
They find that CO2 emissions from farm equipment have grown, on average, by nearly 6% annually since 1985.
Based on “anticipated trends”, they say, increased mechanisation of agriculture could account for 21% of China’s total emissions in 2050, under a pathway to its 2060 net-zero goal.
This could make it harder for China to meet its emissions reduction goals, as well as “degrade” its air quality, the authors say.
However, the study also finds that widespread adoption of machinery powered with renewable energy could mitigate 65-70% of these emissions.
One expert, who was not involved in the research, tells Carbon Brief that the work is “valuable”, although she adds that farm machinery would likely not reach such a large proportion of total emissions:
“If China is making rapid progress in reducing emissions from other emitters…then I expect it will have made significant progress in the decarbonisation of agricultural machinery too.”
Machinery-related emissions
Food systems are responsible for around one-third of human-driven greenhouse gas emissions.
This figure includes everything associated with producing food – from the emissions caused by deforestation or other land-use changes to the methane belched by cows or off-gassed from manure.
In the new study, researchers rely on data from the China Statistical Yearbook, which provides annual statistics on a wide range of socioeconomic indicators. From the yearbook, the researchers use data on both the quantity and power of agricultural machinery in use in the country, as well as the properties of the fuel used in the machinery, cultivated land area, population and more.
In addition to CO2 emissions, the researchers calculate the machinery-related emissions of three types of air pollutants: fine particulate matter (PM2.5), nitrogen oxides (NOx) and total hydrocarbons (THC).
They divide the equipment into four categories: small tractors, large tractors, field-management machinery and harvest machinery. Then, they calculate the CO2, PM2.5, NOx and THC emissions for each type of machinery in each year.
The chart below shows the CO2 emissions for the study period of 1985 to 2020. The bars show emissions resulting from harvesting machinery (light blue), field-management machinery (pink), small tractors (light green) and large tractors (dark green).
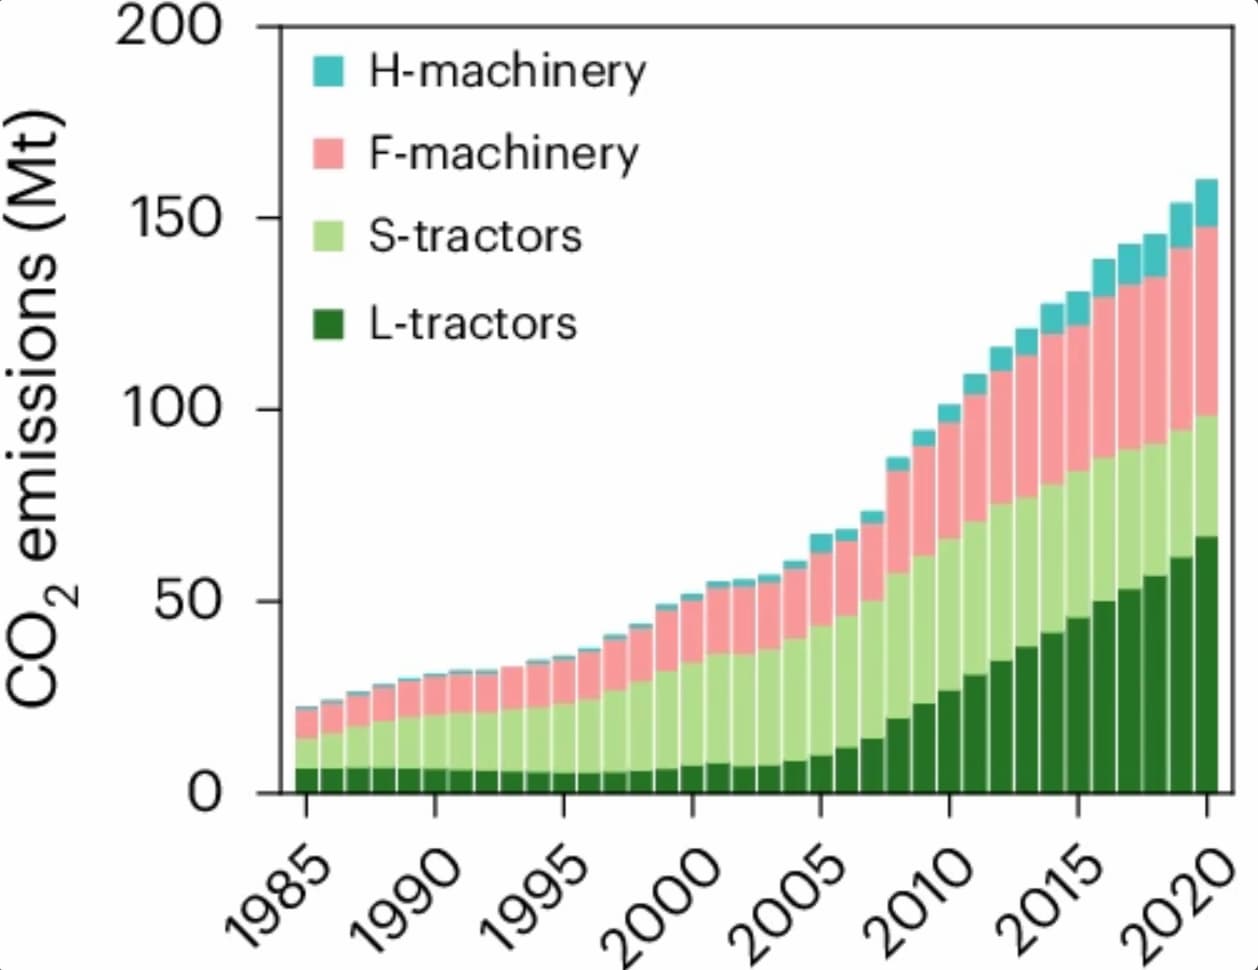
Annual emissions of CO2 from farm machinery over 1985-2020. The colours indicate the type of machinery responsible for the emissions: small tractors (light green), large tractors (dark green), field-management machinery (pink) and harvesting machinery (light blue). Source: Zhuang et al. (2025)
They find that the total farm equipment CO2 emissions have increased from around 23m tonnes of CO2 (MtCO2) in 1985 to nearly 160MtCO2 in 2020, growing annually by a rate of 5.7%.
This is equivalent to around 1.5% of the country’s total emissions in 2020. While this is only a small percentage, the amount of CO2 actually exceeds the annual emissions of entire countries – such as the Netherlands, the Philippines and Nigeria, the authors note.
In particular, the emissions contribution of large tractors has increased steadily since 2005. The authors attribute this to a “series of policies to promote large-scale machinery”.
Disaggregating the emissions of agricultural machinery from food systems more broadly “provides a unique perspective”, says Prof Zhangcai Qin, from Sun Yat-sen University in Guangzhou, China. Qin, who was not involved in the new study, says that doing so “allow[s] policymakers to design targeted interventions without compromising agricultural productivity”.
Regional breakdown
The researchers also break the emissions down to the province level, finding a large range of agricultural machinery emissions – from 0.1MtCO2 for the lowest-emitting provinces to 17.5MtCO2 for the highest emitters.
They find that five provinces in eastern and north-eastern China – Shandong, Henan, Heilongjiang, Hebei and Anhui – account for more than 40% of agricultural machinery emissions. Together, those provinces contain one-third of the country’s cropland area and about 46% of the total engine power.
However, even between these high-emitting regions, the makeup of the machinery was different, with some provinces more dependent on large tractors and some more dominated by field-management machinery.
The sub-national emissions analysis is one of the key advances of the new research, says Dr Hannah Ritchie, deputy editor at Our World in Data. Ritchie, who was not involved in the study, explains:
“This spatial resolution of emissions estimates is valuable, because there is such large [variety] across a country of China’s size. It also offers important insights into potential emissions pathways in the future, under different rates of mechanisation and low-carbon technology uptake.”
Growth factors
The researchers identify four socioeconomic factors contributing to the rise in emissions: population growth, changes in per-capita cropland area, level of mechanisation and emissions intensity.
The chart below shows the change in CO2 emissions (black) due to changes in emission intensity (dark blue), level of mechanisation (light blue), per-capita cropland area (yellow) and population (orange).
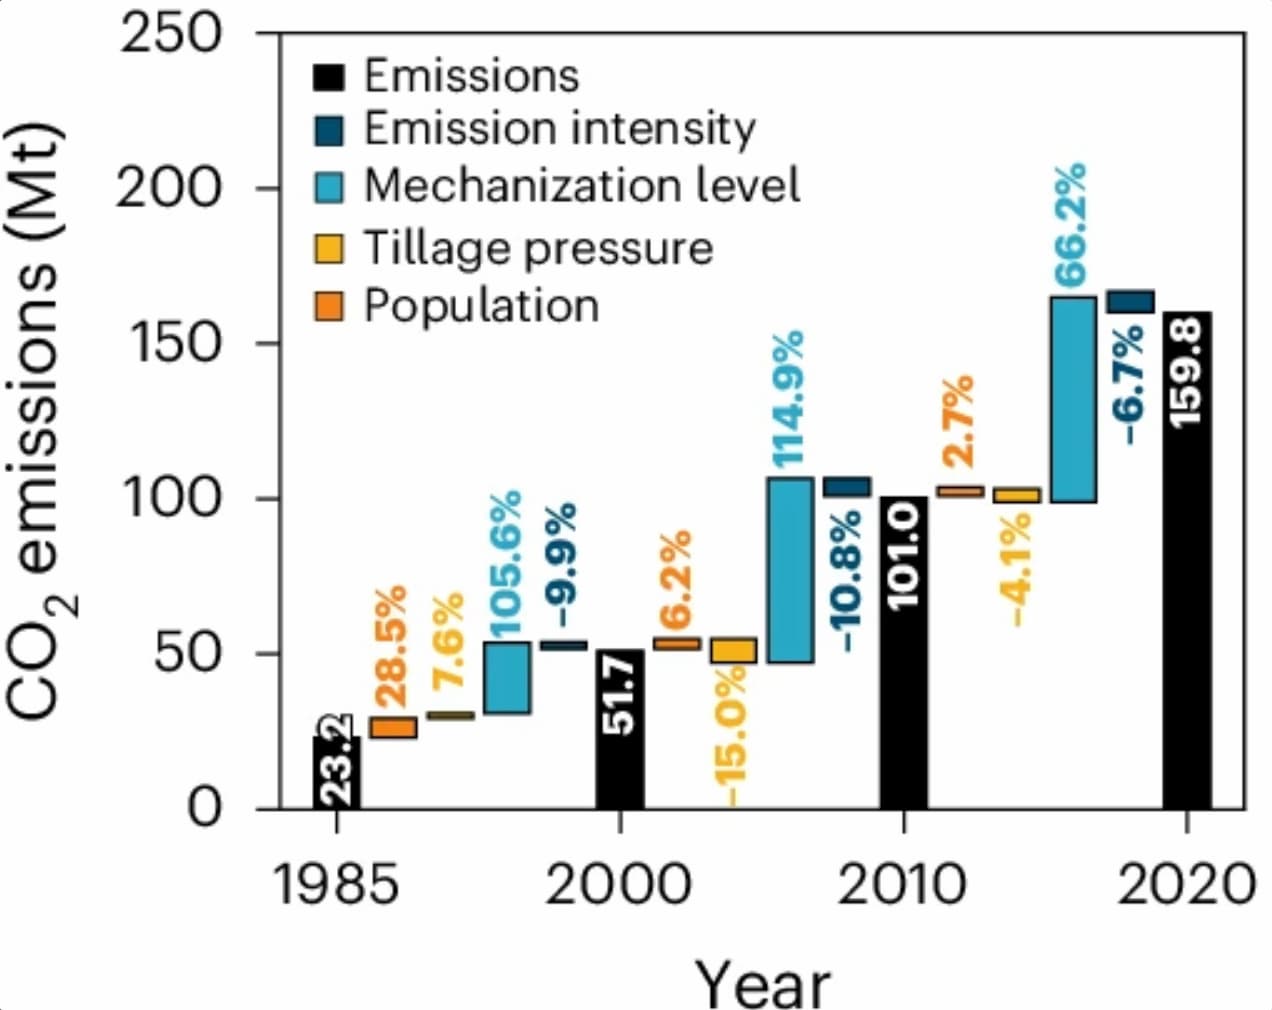
Total CO2 emissions (black) for the years 1985, 2000, 2010 and 2020. The emissions are broken down by four contributing factors: changes in emission intensity (dark blue), level of mechanisation (light blue), per-capita cropland area (yellow) and population (orange). Source: Zhuang et al. (2025)
Of those, the increasing level of mechanisation “dominate[s]” the change in emissions, the paper says. It notes that these changes alone were responsible for around a 100% increase in emissions over 1985-2000.
Population growth was another large driver of increasing farm equipment emissions over the early part of the study period, the study notes, but it has been less of a factor since 2000.
In contrast, increasing emissions intensity uniformly acted to decrease emissions, the authors say, while “tillage pressure” increased emissions early on in the study period, but decreased emissions since 2000.
Carbon goals
Under current policies, China aims to “achieve comprehensive mechanisation in major crop production processes by 2035”, the authors note.
Therefore, unabated continued growth of agricultural mechanisation could compromise China’s efforts to achieve its “dual-carbon” goals, they warn.
(The term “dual-carbon” goals refers to the country’s pledge to reach peak CO2 emissions before 2030 and to achieve carbon neutrality before 2060.)
They write that effective mitigation of these emissions will require different strategies in the short- and long-term future, noting that near-term availability means that “biofuels and natural gas [will] play an important role over the coming decade”.
In the longer term, they say, renewable energy sources, as well as green hydrogen, “have the largest mitigation potential”. Previous work has shown that using automated equipment, electric tractors and renewable energy sources can reduce agricultural emissions by 90%.
Ritchie says she is “a bit sceptical that the relative contributions of agricultural machinery will be as high as 20% in 2050”. She adds:
“This rests on the assumption that these emissions go mostly unabated, while most other sectors rapidly decline. If China is making rapid progress in reducing emissions from other emitters, including larger on-road transport, such as trucks and other agricultural emissions…then I expect it will have made significant progress in the decarbonisation of agricultural machinery too.”
This article was originally published on Carbon Brief under the Creative Commons BY NC ND licence. Read the original article.
.jpg)


